

In this second post in an occasional series questioning some of the basics of paediatric assessment, we will examine clinical markers of dehydration, something we have to watch out for every day in the department.
I can remember little from my paediatric placement as a medical student (over 20 years ago now) except for one thing. I was taught that dehydrated children have decreased skin turgor, dry mucous membranes, delayed capillary refill time and altered sensorium. Having spent some time examining the validity of capillary refill time as an assessment tool, I thought I should examine additional dogmas I have been exposed to.
Accurate measurement of dehydration can be used to target therapy and potentially reduce morbidity, especially in children with acute gastroenteritis. Globally, diarrhoeal illness poses a huge healthcare burden, with an astonishing 1.7 billion episodes estimated to occur each year, leading to around 36 million admissions and over 700,000 deaths – about 10% of all child deaths worldwide (Ed. note – this latter figure is probably a gross under-representation).
Several assessment methods and scales have emerged; therefore, it is worth examining some of the most frequently used. An accurate assessment of hydration status may impact both the management and disposition of the child. Overestimation can be as harmful as underestimation.
“He supposed that even in Hell, people got an occasional sip of water, if only so they could appreciate the full horror of unrequited thirst when it set in again.”
― Stephen King, Full Dark, No Stars
How accurate is the clinician’s gestalt when assessing a child clinically?
It has been suggested that doctors are right about 75% of the time when picking mild dehydration (under about 3%) and found difficulty differentiating severe dehydration from more moderate dehydration. But then, what is Gestalt in this setting? It is a collection of impressions formed by the subconscious mind as it processes the history and a focused clinical exam.
Is that any better than the parents’ guess?
A prospective observational trial of 132 children-parent dyads had a similar sensitivity of approximately 73% for predicting 5% dehydration. Parents don’t have the same experience as physicians concerning physical exam findings, so they were guided more by historical factors. Normal fluid intake and a history of normal urine output (usually the number of wet nappies) have a likelihood ratio of near zero. The child is highly unlikely to be significantly dehydrated if both are present.
What about skin turgor?
Turgor has been used to diagnose dehydration for over 50 years. When originally described by Laron in 1957, the examiner was supposed to pinch a small skin fold on the abdominal wall and watch for elastic recoil. Now, most of us use the hand or forearm rather than the belly. Similarly, there is a wide variety of normal capillary refill times and a wide variation in elastic recoil, and no true range has been documented. Skin turgor and elastic recoil is, instead, classified into immediate, slightly delayed or prolonged. Several conditions may falsely normalise (e.g., obesity, hypernatraemia) or prolong (e.g., malnutrition) the recoil rate.
What about sunken eyes and dry mucous membranes?
They add very little to clinical reasoning, with a pooled positive likelihood ratio of only 1.7.
Was my mum right when she told me I had to drink water as my wee was too dark?
There is something in this not-so-old wives’ tale. Uosm increases in response to dehydration, but there is no international consensus on what Uosm cut-off indicates dehydration. Although 800 mOsm/kg is commonly used, be wary, as this level may depend on other factors, including dietary intake.
Urine colour is strongly associated with urine osmolarity (Uosm). Urine colour has been validated as a biomarker for dehydration in adults and children over eight years of age.
A bedside 8-point urine colour chart has been developed; although it may detect dehydration, it is not very specific for the degree of dehydration. Other urinary indices, such as specific gravity and urine ketone levels, show no correlation with the presence or absence of significant dehydration.

Some people have even tried serial use of a handheld bladder scanner instead of bedside ultrasound to assess urine output, but this has little utility in clinical practice.
So, how do we know the percentage of dehydration?
Most studies use the percentage of body weight lost as the gold standard. Unless a child has been weighed recently, parents may be wildly inaccurate in their predictions. Researchers can quantify dehydration by comparing their weight when well (in the post-illness phase) with their presenting weight.
per cent dehydration = baseline weight – admission weight) / baseline weight x 100
Experimental studies using radioisotope-labelled albumin have shown that the percentage of body weight lost is directly comparable to the percentage of plasma volume lost.
Is it even clinically relevant?
Most studies on the assessment of dehydration have focused on diarrhoeal illness, but the assessment and management of dehydration are also cornerstones of managing diabetic ketoacidosis (DKA). In a small Australian study, there was little agreement between the assessed and measured degrees of dehydration. There was a tendency to overestimate dehydration in those less than 6% dehydrated with DKA and to underestimate those with more than 6% fluid loss. Underestimation may lead to morbidity with an increased risk of overhydration and cerebral oedema.
Dehydration scales
While individual signs and symptoms are low in sensitivity, they may become much more powerful when combined. There are many dehydration scales to choose from.
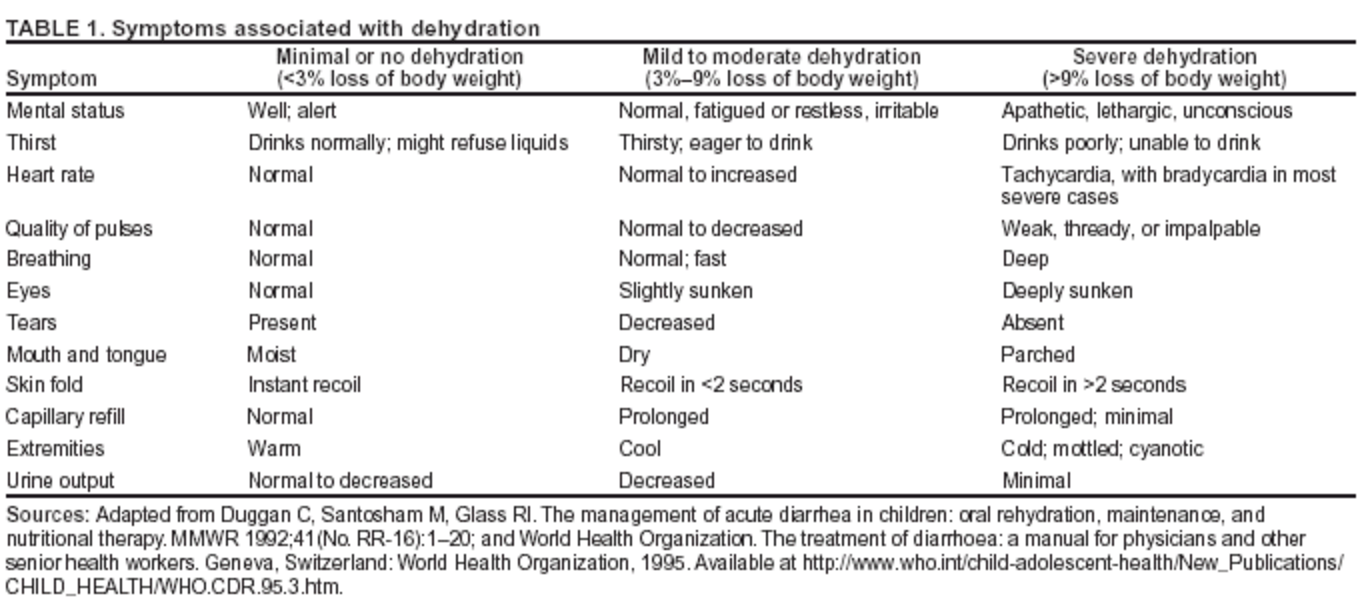
International authorities suggest classifying dehydration into three categories based on presentation: no dehydration, some dehydration, or severe dehydration. Only those in the severe group should be considered for IV fluid hydration. Given that diarrhoeal illness is much more of a concern in resource-poor settings, the World Health Organisation (WHO) Integrated Management of Childhood Illness (IMCI) guidelines suggest a combination of signs and symptoms to help differentiate the degree of dehydration.
Such scales must be easily used by nurses and non-physician healthcare workers and be reproducible.
The Clinical Dehydration Scale (CDS)
The Clinical Dehydration scale was developed using a cohort of 137 children with gastroenteritis and has undergone limited prospective external validation. The earlier studies involved very few children with more severe dehydration and did not mention the scale’s inter-observer reliability. Larger studies have shown little correlation between CDS and percentage weight gain during recovery, a proxy for dehydration status. With this in mind, it should probably not be used to guide treatment.

As you can see, it utilizes four key examination findings: the presence or absence of tears, the state of the mucous membranes, whether the eyes are sunken or not, and finally, the very ephemeral general appearance of the child. Again, each item has little value but a combined sensitivity of approximately 68%.
There is moderate inter-observer reliability (κ = 0.52).
The WHO dehydration scale
Rather than being evidence-based, the WHO scale was primarily derived from expert opinion, and many studies have found it inaccurate.
The Gorelick scale
This scale was based on an analysis of just 64 kids. It found that four key variables—prolonged capillary refill time >2 seconds, dry mucous membranes, absence of tears, and an unwell appearance—combined to be the best predictor of clinically significant dehydration. You might notice that this sounds very similar to the clinical dehydration scale.
The DHAKA dehydration scale
Like many seeking a memorable acronym, the Dhaka, Bangladesh group settled on the DeHydration: Assessing Kids Accurately (DHAKA) scale. Recursive partitioning and logistic regression were used to create the scale. The DHAKA scale had a Κ value of 0.75 (95% CI 0.66-0.88). It has a positive LR of 2.0 and a negative LR of 0.23 for severe dehydration.
Several other scales exist, including the Vesikari and modified Vesikari scores.
So, which dehydration score is best?
Pringle et al. did a small study comparing the CDS, Gorelick,
and WHO scales in resource-poor environments. Of the 73 children enrolled, 52 were available for analysis after excluding deaths and dropouts. Here are the sensitivity values for detecting moderate dehydration.

If we can’t rely on low-tech to gauge the degree of dehydration, then what about something a little more modern?
Ultrasound
Ultrasound has been used with varying degrees of success to determine fluid responsiveness in an adult population. Although measurement of inferior vena cava (IVC) diameter and aorta-to-IVC ratio has shown promise, a systematic review published earlier this year questioned its validity. Even the cooly-named BUDDY study (Bedside Ultrasound to Detect Dehydration in Youth) showed little correlation between the level of dehydration and inspiratory collapse of the IVC (in spontaneously breathing patients).
Is anything fancier in the works?
Bio-impedance monitoring may be even more accurate (think of those fancy scales you can buy) to assess total body water content. However, you still need an accurate baseline to determine the degree of dehydration.
Reading through all of these papers, I am once again struck by the heterogeneity of the studies and the small number of participants. We have been basing our practice on studies with little external validation and fewer than 200 patients. I was given a rubric for the clinical assessment of dehydration that was held up as the standard throughout my time in practice, and I’m not sure if I should continue using it.
With all of that in mind, what should you do?
No single clinical sign can accurately predict the presence or severity of dehydration. When used in combination, in the form of a dehydration scale, we are no closer to an answer. It seems that my gestalt is probably as accurate as any particular scale.
At DFTB19, Nikki Abela challenged the assumption that we are great at assessing hydration status in children. We could all do better. We are right between 25% and 80% of the time. That broad spectrum of exactitude encompasses the experience of years.
References
If you are only going to read one article, then read this first one from JAMA. It’s an oldie but a goody.
Steiner MJ, DeWalt DA, Byerley JS. Is this child dehydrated?. JAMA. 2004 Jun 9;291(22):2746-54.
Bailey B, Gravel J, Goldman RD, Friedman JN, Parkin PC. External validation of the clinical dehydration scale for children with acute gastroenteritis. Academic Emergency Medicine. 2010 Jun 1;17(6):583-8.
Baron S, Courbebaisse M, Lepicard EM, Friedlander G. Assessment of hydration status in a large population. British Journal of Nutrition. 2015 Jan 14;113(01):147-58.
Dorrington K. Skin turgor: do we understand the clinical sign?. The Lancet. 1981 Jan 31;317(8214):264-6.
Finberg L. Assessing the clinical clues to dehydration. Contemp Pediatr. 1990;9:45-57.
Friedman JN, Goldman RD, Srivastava R, Parkin PC. Development of a clinical dehydration scale for use in children between 1 and 36 months of age. The Journal of pediatrics. 2004 Aug 31;145(2):201-7.
Gorelick MH, Shaw KN, Murphy KO. Validity and reliability of clinical signs in the diagnosis of dehydration in children. Pediatrics. 1997 May 1;99(5):e6-.
Kavouras SA, Johnson EC, Bougatsas D, Arnaoutis G, Panagiotakos DB, Perrier E, Klein A. Validation of a urine color scale for assessment of urine osmolality in healthy children. European journal of nutrition. 2016 Apr 1;55(3):907-15.
King CK, Glass R, Bresee JS, Duggan C, Centers for Disease Control and Prevention. Managing acute gastroenteritis among children. MMWR Recomm Rep. 2003 Nov 21;52(RR16):1-6.
Koves IH, Neutze J, Donath S, Lee W, Werther GA, Barnett P, Cameron FJ. The accuracy of clinical assessment of dehydration during diabetic ketoacidosis in childhood. Diabetes care. 2004 Oct 1;27(10):2485-7.
Kwon H, Jung JY, Lee JH, Kwak YH, Kim DK, Jung JH, Chang IW, Kim K. Sonographic aorta/inferior vena cava cross-sectional area index for evaluation of dehydration in children. The American Journal of Emergency Medicine. 2016 Jun 15.
Laron Z. Skin turgor as a quantitative index of dehydration in children. Pediatrics. 1957 May 1;19(5):816-22.
Levine AC, Glavis-Bloom J, Modi P, Nasrin S, Rege S, Chu C, Schmid CH, Alam NH. Empirically Derived Dehydration Scoring and Decision Tree Models for Children With Diarrhea: Assessment and Internal Validation in a Prospective Cohort Study in Dhaka, Bangladesh. Global Health: Science and Practice. 2015 Sep 10;3(3):405-18.
Porter SC, Fleisher GR, Kohane IS, Mandl KD. The value of parental report for diagnosis and management of dehydration in the emergency department. Annals of emergency medicine. 2003 Feb 28;41(2):196-205.
Pringle K, Shah SP, Umulisa I, Munyaneza RB, Dushimiyimana JM, Stegmann K, Musavuli J, Ngabitsinze P, Stulac S, Levine AC. Comparing the accuracy of the three popular clinical dehydration scales in children with diarrhea. International journal of emergency medicine. 2011 Sep 9;4(1):1.
Roland D, Clarke C, Borland ML, Pascoe EM. Does a standardised scoring system of clinical signs reduce variability between doctors’ assessments of the potentially dehydrated child?. Journal of paediatrics and child health. 2010 Mar 1;46(3):103-7.
Vega RM, Avner JR. A prospective study of the usefulness of clinical and laboratory parameters for predicting percentage of dehydration in children. Pediatric emergency care. 1997 Jun 1;13(3):179-82.
Very helpful!